Introduction
Covering the third quarter of the year 2020, this report witnessed a continuation of the social and labor protests that denounce the economic situation in Egypt. These protests amounted to nearly 75 cases which took place in the various protesting forms during the reporting period.
- Protest vigils came to the forefront by 15 vigils being monitored
- Followed by suicide cases which have been noticeably on the rise with 14 cases being monitored, comparing to the previous report which monitored only two cases, a matter which indicates a potential risk that needs to be addressed.
During the months covered by the report, the Social Movements Monitoring Center Program monitored: 45 labor and professional protests and 30 social protests out of a total of 75 protests.
The following chart shows the distribution of the labor, professional and social protests:
| Labor and Professional Protests | Social Protests |
| 60% | 40% |

First: Labor and Professional Protests
During the months of June, July and August, the Social Movements Monitoring Center Program monitored 45 protests distributed as follows:
- Protest vigils: 10 cases
- Gathering: 7 cases
- Petitions or complaints: 7 cases
- Strikes: 7 cases
- Sit-ins: 6 cases
- Suicide: 3 cases
- Threatening to strike: 3
- Protests: 2
The following chart shows the methods of labor and professional protests:
| Protest vigils | 23% |
| Gathering | 15% |
| Petitions or complaints | 15% |
| Strikes | 15% |
| Sit-ins | 13% |
| Suicide cases | 7% |
| Threatening to strike | 7% |
| Protests | 5% |

Second: Social protests:
During the months of June, July and August, the Social Movements Monitoring Center Program monitored 45 protests distributed as follows:
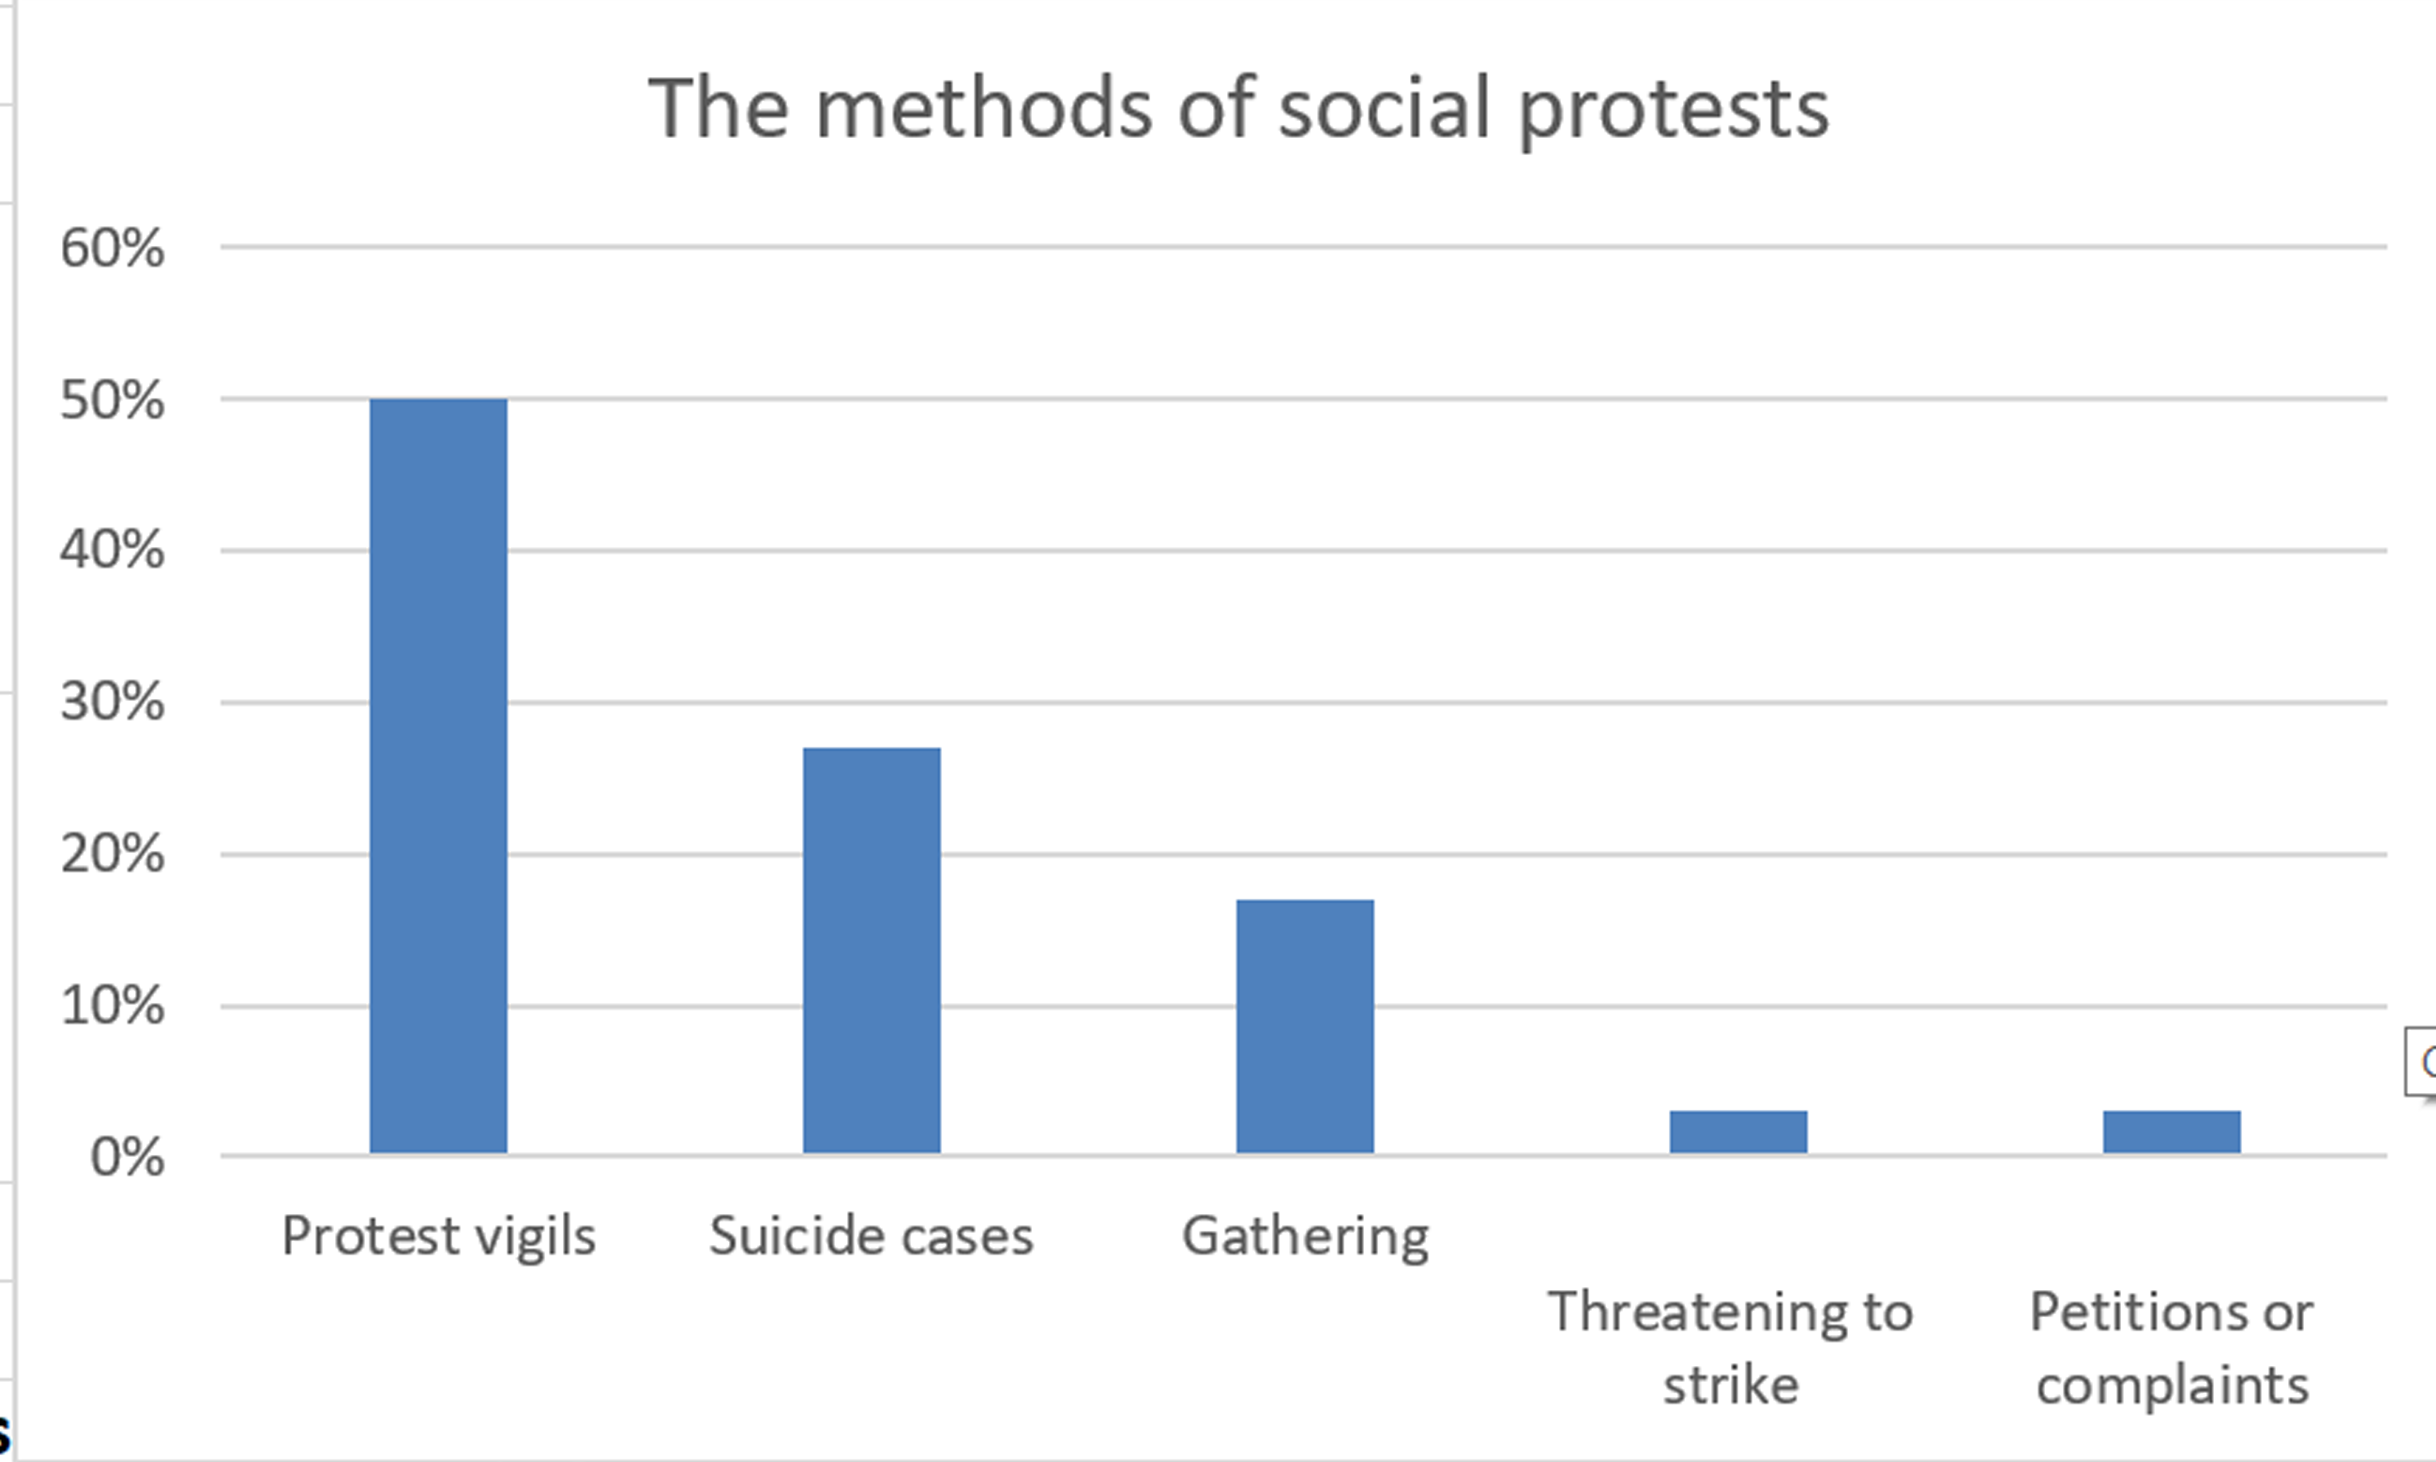
- Protest vigils: 15 cases
- Suicide: 8 cases
- Gathering: 5 cases
- Threatening to protest: 1 case
- Petitions or complaints: 1 case
The following table shows the methods of social protests:
| Protest vigils | 50% |
| Suicide | 27% |
| Gathering | 17% |
| Threatening to protest | 3% |
| Petitions or complaints | 3% |

Third: The geographical distribution of labor and professional protests:
Cairo governorate topped the list of governorates in terms of the number of labor and professional protests with 13 protests being monitored, followed by Alexandria with 7 protests, followed by Giza governorate with five protests. Then came in the fourth place Menuofia governorate with 4 protests monitored. Sharqyia, Ismailia and Daqahlyia governorates ranked fifth with 3 protests recorded in each one, followed by Al-Gharbyia governorate which recorded two protests during the reporting period. Then came in the final place the following governorates with only one protest monitored in each of them: Kafr El-Sheikh, Aswan, Suez, Beheira, and Fayoum.
The following table illustrates the geographical distribution of labor and professional protests:
| 13% | Cairo |
| 7% | Alexandria |
| 5% | Giza |
| 4% | Menoufia |
| 3% | Ismailia |
| 3% | Daqahlyia |
| 3% | Sharqyia |
| 2% | Gharbyia |
| 1% | Kafr Al-Sheikh |
| 1% | Aswan |
| 1% | Suez |
| 1% | Beheira |
| 1% | Fayoum |

Fourth: The geographical distribution of Social protests:
Cairo governorate topped the list of governorates in terms of the number of social protests with 7 protests being monitored, followed by Giza with 5 protests, followed by Alexandria, Sharqyia, Qaluobyia, and Gharbyia governorates with three protests each. Then came in the fourth and final place the following governorates with 1 protest monitored in each of them: Aswan, Minya, Asuit, The Red Sea, Damietta, Fayoum, Sohag, Daqahlyia, Beheira, and Menoufia, with 1 protest monitored in each of them.
The following table illustrates the geographical distribution of social protests:
| 7% | Cairo |
| 5% | Giza |
| 2% | Alexandria |
| 2% | Sharqyia |
| 2% | Qaluobyia |
| 2% | Gharbyia |
| 3% | Aswan |
| 2% | Minya |
| 1% | Asuit |
| 1% | Red Sea |
| 1% | Damietta |
| 1% | Fayoum |
| 1% | Sohag |
| 1% | Daqahlyia |
| 1% | Beheira |
| 1% | Menoufia |

Fifth: The sectoral distribution of labor and professional protests
The metallurgical sector topped the list of protesting sectors during the period covered by the report with six protests being monitored; and this due to the low wages and salaries of workers in the factories covered by the sector and their repeated demands to apply the minimum wage. The second sector is represented in the insurance, banking and transportation sector with 5 protests each, followed by the sectors of: (tourism, housing, education and scientific research), with 4 protests each. Then came the (health, localities and services) sector in the fourth place with 3 protests per sector, followed by the (civil society and employees) sector- in fifth place-with two protests each. The following sectors then came at the end of the list with one protest monitored in each of them: trade, sports, textile, construction and timber construction, contracting, chemical industries, food industries, and telecommunications.
The following chart shows the sectoral distribution of the labor and professional protests
| 6 | Metallurgical sector |
| 5 | Insurance and banking |
| 5 | Transportation |
| 4 | Tourism |
| 4 | Housing |
| 4 | Education and scientific research |
| 3 | Health |
| 3 | Localities and services |
| 2 | Employees and civil society |
| 1 | Trading |
| 1 | Sports |
| 1 | Textile |
| 1 | Construction and timber |
| 1 | Contracting |
| 1 | Chemical industries |
| 1 | Justice |
| 1 | Food Industry |
| 1 | Telecommunications |

Sixth: The sectoral distribution of social protests
The education and scientific research sector topped the list of protesting sectors during the period covered by the report with six protests being monitored; and this is due to students and teachers ’fear of taking the “Thanawayia Amma” (high school) final exams owing to the spread of the Coronavirus pandemic. The second sector is represented in the “employees and the civil society” sector with 5 protests each, followed by the Metallurgical sector with 4 protests. Then came the (housing, insurance and banking) sectors in the fourth place with 3 protests per sector, followed by the (security, transport and communications, chemical industries) sectors- in fifth place-with two protests each. The following sectors then came at the end of the list with one protest monitored in each of them: localities and services, contracting and construction, sports.
The following chart shows the sectoral distribution of social protests
| 6 | Education and Scientific Research |
| 5 | Employees and civil society |
| 4 | Metallurgical Sector |
| 3 | Housing |
| 3 | Insurance and Banking |
| 2 | Security |
| 2 | Transportation |
| 2 | Chemical industries |
| 1 | Localities and services |
| 1 | Contracting and Construction |
| 1 | Sports |

The Social Movements Monitoring Center program asserts that the protests that took place during the reporting period came in individual form, apart from any trade union organizations or social movements. It also confirms that these protests were organized by workers demanding to improve their economic and financial conditions.


